Your wearable tracks five game-changing metrics that reveal your body’s true training response. Heart Rate Variability shows your autonomic nervous system’s recovery state, while Training Stress Score quantifies workout demands using intensity and duration. VO2 Max estimation monitors your aerobic capacity improvements, and sleep quality metrics assess nocturnal recovery through physiological signals. Power output distribution optimizes your training zones for maximum efficiency. These insights transform how you’ll approach your next workout decisions.
Heart Rate Variability Analysis for Recovery Optimization
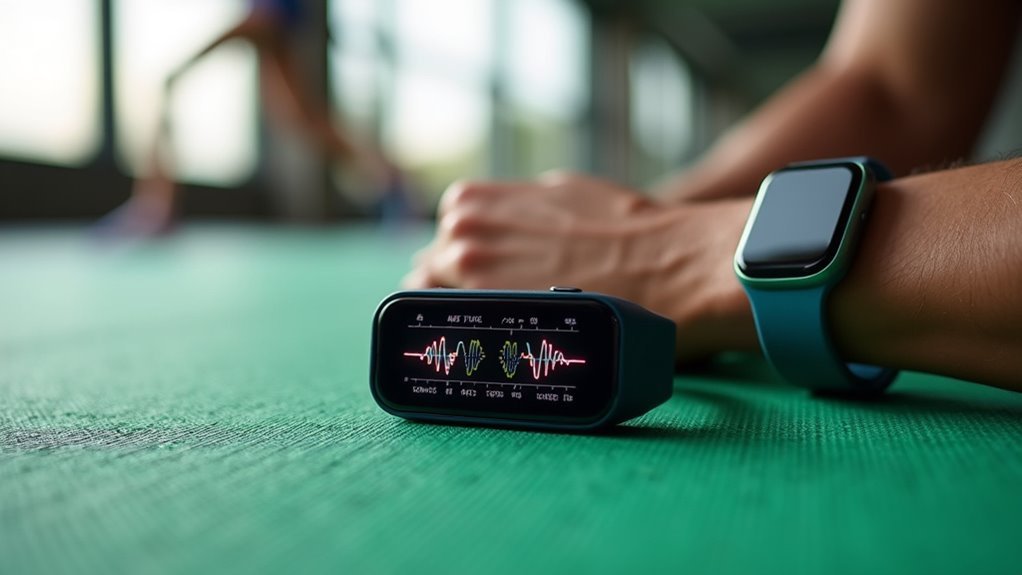
While traditional heart rate monitoring simply tracks beats per minute, heart rate variability (HRV) reveals the vital millisecond variations between each heartbeat that indicate your autonomic nervous system’s function.
Your wearable device uses photoplethysmography or electrocardiography to capture these subtle fluctuations, providing significant recovery insights that prevent overtraining.
Advanced sensors in your wearable continuously detect microscopic heart rhythm changes, delivering precise recovery data to optimize your training schedule.
Higher HRV typically signals better recovery and stress resilience, while lower readings suggest fatigue or elevated stress levels.
You’ll establish personalized baselines through continuous monitoring, enabling data-driven training decisions. Research has shown that continuous tracking can help predict cardiovascular and metabolic disorders before they become serious health complications.
This real-time feedback allows you to adjust workout intensity dynamically based on your body’s readiness.
Training Stress Score and Accumulated Load Tracking
Beyond measuring individual workout intensity, your wearable device calculates Training Stress Score (TSS) to quantify the complete physiological demand of each session by combining both intensity and duration into a single meaningful number.
TSS normalizes effort across different athletes by comparing your performance to individual thresholds like functional threshold power or pace, making 100 TSS equivalent to a maximal 60-minute threshold effort.
Your device tracks accumulated load through key metrics:
- Chronic Training Load (CTL) – reflects your long-term fitness development
- Acute Training Load (ATL) – indicates recent fatigue accumulation
- Training Stress Balance (TSB) – shows recovery versus fatigue ratio
- Performance Management Chart – visualizes seasonal training progression
- Sport-specific adaptations – cycling uses power, running uses pace data
These metrics prevent overtraining while optimizing performance peaks. Understanding these recovery levels helps athletes plan their training schedule, as scores below 150 indicate recovery likely complete by the next day, while scores above 450 may require several days of rest.
VO2 Max Estimation and Aerobic Capacity Monitoring
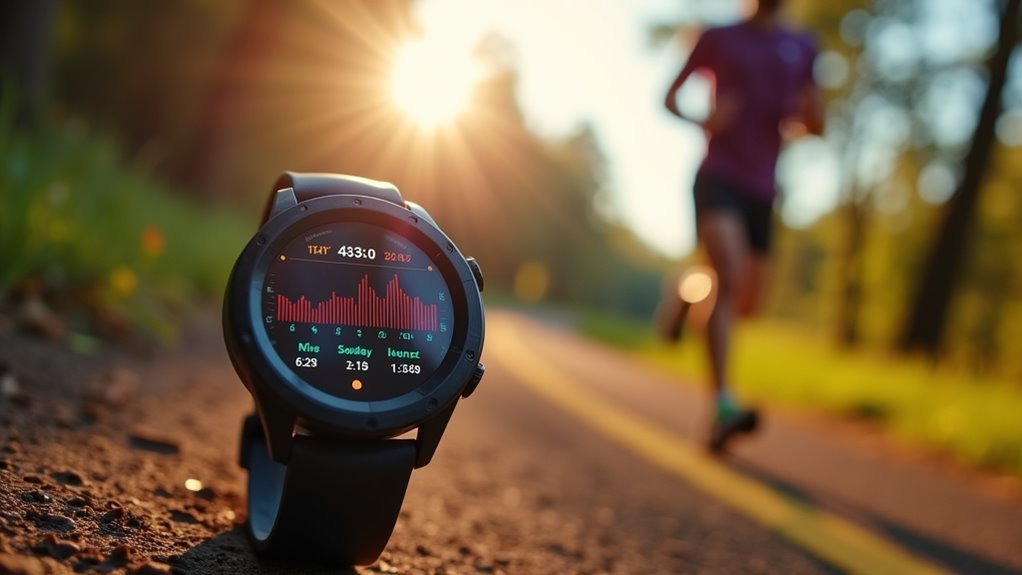
Your wearable device estimates VO2 max—the maximum amount of oxygen your body can utilize during intense exercise—by analyzing heart rate patterns, activity data, and performance metrics through sophisticated algorithms.
These devices use machine learning and deep neural networks to process large amounts of sensor data, compressing it into meaningful fitness predictions.
However, accuracy varies greatly between brands. Garmin smartwatches typically maintain a 5% margin of error, while other devices can exceed 20% deviation from gold standard spirometry measurements.
For a device to be considered accurate, it shouldn’t exceed Nelson’s 10% error threshold.
Your demographics and activity levels affect estimation accuracy, with devices often overestimating VO2 max, particularly for men. Research shows that wearables demonstrate higher accuracy in individuals with good fitness levels compared to those with lower cardiorespiratory fitness.
Continuous monitoring over extended periods helps refine these predictions.
Sleep Quality Metrics and Nocturnal Recovery Assessment
When you drift off to sleep each night, your wearable device transforms into a sophisticated monitoring system that tracks multiple physiological signals to assess sleep quality and recovery potential. Your device measures sleep efficiency by calculating total sleep time versus wake periods, though accuracy varies between manufacturers.
Motion sensors detect body movements while heart rate variability helps classify sleep stages.
Key metrics your wearable tracks include:
- Sleep stage distribution analyzing time spent in light, deep, and REM phases
- Respiratory rate patterns indicating recovery status and overall health
- Sleep disruptions and awakenings that impact restorative processes
- Sleep onset timing and total duration for pattern analysis
- Combined sleep quality scores integrating multiple physiological markers
While these devices can’t match polysomnography’s clinical precision, they provide valuable insights for optimizing your recovery. Performance evaluations often show bias toward young, healthy adults, lacking representation of diverse populations with varying health conditions.
Power Output Distribution and Training Zone Efficiency
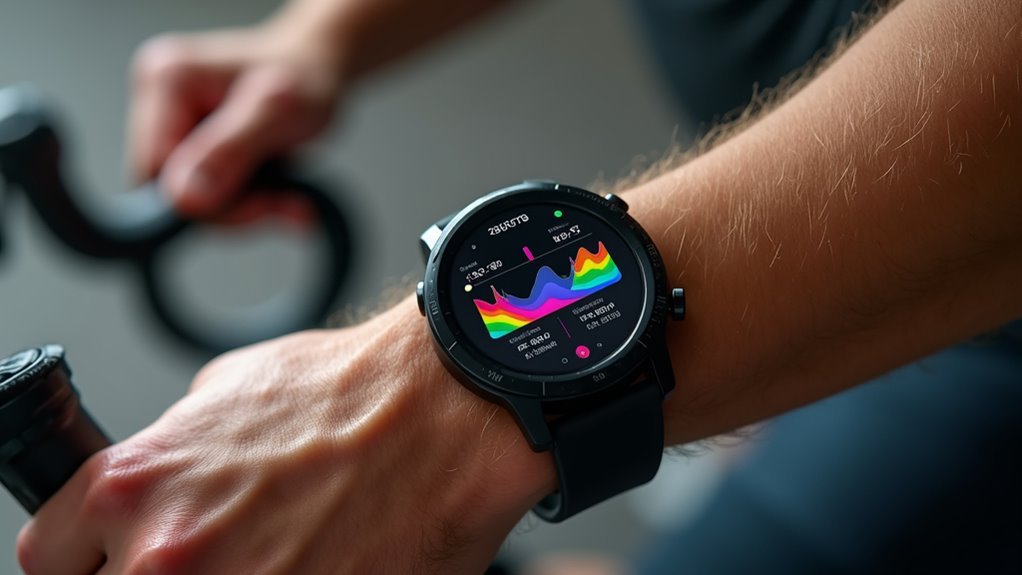
As your training intensity increases, modern wearable devices capture power output data through integrated strain gauges and accelerometers, transforming raw mechanical work measurements into actionable insights about your performance distribution.
Modern wearables transform raw mechanical work into actionable performance insights through sophisticated strain gauges and accelerometer integration.
This segmentation reveals periods of peak and submaximal effort, helping you identify pacing strategies and neuromuscular fatigue patterns.
Your wearable establishes training zones by integrating heart rate data with power output, defining intensity levels based on lactate threshold and critical power approximations.
You’ll receive real-time feedback on zone compliance, ensuring you maintain desired physiological loads for ideal adaptation.
The correlation between your heart rate and power output detects discrepancies between external and internal training loads, guiding recovery adjustments while estimating VO2max and critical speed for personalized zone targeting. However, real-time analysis methods often underestimate locomotive workload compared to post-session data processing.
Frequently Asked Questions
How Accurate Are Wearable Calorie Burn Measurements During High-Intensity Interval Training?
Wrist-worn fitness trackers aren’t reliable for calorie burn during HIIT, with error rates of 27-93%. You’ll get more accurate heart rate data, but calorie estimates can be off by 40-80% during high-intensity intervals.
Can Wearable Tech Detect Early Signs of Overtraining Syndrome Effectively?
Yes, you’ll find wearable tech effectively detects overtraining syndrome through HRV monitoring, sleep analysis, and performance tracking. These devices alert you to physiological changes before symptoms appear, enabling preventive action.
Which Wearable Metrics Best Predict Injury Risk in Endurance Athletes?
You’ll find cadence drops, increased ground contact time, and declining heart rate variability most predictive of injury risk. Watch for gait asymmetry patterns and force impact spikes—they’re early warning signs before pain appears.
How Do Environmental Factors Affect Wearable Sensor Accuracy and Data Quality?
Temperature changes cause your sensors to drift, while humidity damages electrical components. You’ll notice poor data quality when pollutants interfere with air monitoring and background noise affects acoustic sensors, requiring frequent recalibration.
What’s the Optimal Frequency for Syncing Wearable Data With Coaching Platforms?
You should sync wearable data daily for ideal coaching effectiveness. This frequency maintains up-to-date records without overwhelming data volume, while enabling timely interventions and consistent progress tracking for your clients.
In Summary
You’ve now got five powerful metrics to transform your training approach. By monitoring your HRV for recovery timing, tracking TSS for workload management, watching VO2 max trends for fitness gains, analyzing sleep data for ideal rest, and reviewing power distribution for zone efficiency, you’ll make data-driven decisions that’ll elevate your performance. Don’t just collect this data—actively use these insights to train smarter, recover better, and achieve your athletic goals faster.


Leave a Reply