You can monitor athlete fatigue during recovery using heart rate variability (HRV) tracking, which measures autonomic nervous system balance, and resting heart rate monitoring during sleep for baseline comparisons. Sleep quality indicators like deep sleep cycles and duration provide essential recovery insights, while daily wellness surveys capture subjective fatigue levels and muscle soreness. Training load calculations combined with stress monitoring help identify overtraining risks. These extensive features work together to optimize your recovery strategies and performance outcomes.
Heart Rate Variability and Recovery Metrics
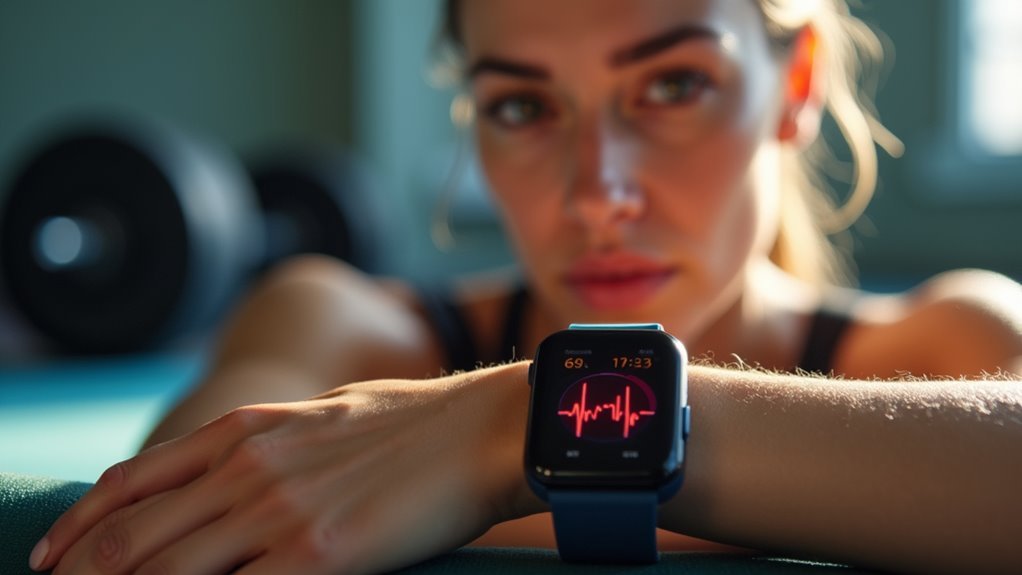
Heart rate variability serves as one of the most powerful tools for monitoring athlete recovery, measuring the subtle time differences between successive heartbeats to reveal your body’s autonomic nervous system balance.
Heart rate variability reveals the hidden rhythm between heartbeats, unlocking critical insights into your body’s recovery state and training readiness.
When you’re well-rested, your parasympathetic nervous system dominates, increasing HRV and signaling readiness for training. Conversely, fatigue or stress activates your sympathetic system, lowering HRV and indicating you need more recovery time.
You can track HRV daily using ECG devices, chest straps, or wrist monitors that calculate metrics like rMSSD and SDNN. HRV measurements can be accurately obtained in ultra-short durations of just one minute, making daily monitoring practical and convenient.
Higher baseline HRV correlates with greater training adaptability, while consistently low readings suggest overtraining risk. By monitoring these trends, you’ll optimize training intensity and prevent burnout while maximizing performance gains.
Resting Heart Rate Monitoring During Sleep
You’ll find that monitoring your resting heart rate during sleep provides more reliable recovery data than daytime measurements since external factors can’t interfere with nocturnal readings.
Your heart rate naturally drops to 40-50 bpm during sleep, and tracking these patterns reveals how well you’re recovering from training stress.
You can use overnight heart rate data to establish morning baselines and identify when elevated rates signal inadequate recovery or overtraining. Athletes with athletic heart syndrome may experience resting heart rates as low as 35 bpm, which is generally harmless for frequent exercisers.
Nocturnal Heart Rate Patterns
Sleep offers an ideal window for monitoring your resting heart rate, as your body naturally minimizes external influences like movement, stress, and postural changes that can skew daytime measurements.
When you’re experiencing fatigue or incomplete recovery, your nocturnal heart rate becomes elevated compared to your baseline values. This elevation often signals ongoing inflammation or autonomic imbalance following heavy exercise sessions.
You’ll find that consistently high nocturnal heart rates may indicate your body hasn’t fully recovered from training stress.
Modern wearable technology like wristbands and chest straps makes this monitoring practical and non-invasive. By establishing your individualized nocturnal heart rate baseline, you can detect early deviations that suggest fatigue or potential overtraining before these issues greatly impact your performance. Research shows that nocturnal heart rate measurements demonstrate very high reliability with intraclass correlation coefficients reaching .97 to .98 between measurement nights.
Sleep Quality Recovery Indicators
While nocturnal heart rate patterns provide valuable insight into your recovery status, analyzing broader sleep quality indicators offers a more thorough picture of how well you’re recovering from training stress.
Your heart rate variability (HRV) measures the variation between heartbeats, reflecting your autonomic nervous system function. Higher HRV values indicate greater parasympathetic activity, which facilitates recovery. Meanwhile, your resting heart rate serves as a recovery barometer—elevated RHR may signal fatigue or overtraining. Sleep deprivation creates adverse hormonal changes that can significantly impact your body’s ability to recover and adapt to training stress.
Key sleep quality recovery indicators to monitor include:
- Sleep duration: Aim for 7-9 hours to optimize HRV and RHR
- Heart rate variability: Higher values suggest better cardiac autonomic function
- Resting heart rate trends: Steady decreases indicate improved fitness
- Sleep efficiency: Lower efficiency often correlates with reduced recovery capacity
Morning Baseline Measurements
Establishing consistent morning baseline measurements transforms your recovery monitoring from guesswork into precise data-driven insights. Your resting heart rate (RHR) serves as a fundamental fatigue indicator, providing essential data about your training status and recovery quality.
During sleep, your heart rate naturally varies between 0-10 bpm, with typical sleeping rates ranging from 40-50 bpm for average individuals. If you’re an athlete, your RHR might drop as low as 30-40 bpm, reflecting superior cardiovascular fitness.
Wearable devices continuously track your heart rate using photoplethysmography, delivering reliable overnight data. These measurements reveal early warning signs of overtraining and inadequate recovery. A spike in RHR suggests poor sleep, illness, or accumulated stress, warranting reduced training intensity.
Sleep Quality and Duration Tracking
You’ll need to track both how long you sleep and how well you rest to understand your recovery status effectively.
Sleep duration metrics reveal whether you’re getting adequate hours, while sleep quality indicators show how restorative that sleep actually is. Sleep loss can significantly impact performance, motivation, effort perception, and cognition.
Your recovery sleep patterns will help you identify trends that directly impact your training readiness and performance potential.
Sleep Duration Metrics
The precision of modern wearable devices has revolutionized how you can track sleep duration and quality during athletic recovery. Devices like Oura Gen 2, WHOOP 3.0, and Somfit detect over 90% of sleep epochs, providing highly sensitive monitoring capabilities.
You’ll find these wearables excel at identifying wake epochs and tracking multiple sleep stages with greater accuracy than previous generations.
Key sleep duration parameters you should monitor include:
- Sleep Duration – Total time spent sleeping
- Sleep Efficiency – Percentage of time actually sleeping while in bed
- Wake After Sleep Onset (WASO) – Time awake after initially falling asleep
- Sleep Latency – Time required to fall asleep
These metrics offer practical, non-invasive monitoring outside laboratory settings, making them ideal for continuous athlete recovery assessment. Multi-sensor devices provide more accurate sleep data than single sensor devices, combining accelerometers and photoplethysmography for enhanced measurement precision.
Sleep Quality Indicators
While sleep duration provides the foundation for recovery monitoring, sleep quality indicators reveal the deeper story of how restorative your rest actually is.
The National Sleep Foundation’s 12 indicators include sleep latency, awakenings per night, and sleep efficiency—each telling you whether you’re achieving truly restorative sleep.
You’ll find that higher sleep efficiency directly correlates with better physiological recovery and enhanced performance.
Sleep stage monitoring tracks your REM and non-REM cycles, showing if you’re getting the deep sleep necessary for muscle repair and cognitive restoration. Athletes with higher deep sleep amounts demonstrate better performance rankings and enhanced recovery metrics.
When your sleep quality indicators decline, you’re facing increased injury risk, performance drops, and compromised immune function.
These metrics help you identify overtraining signs before they derail your progress.
Recovery Sleep Patterns
Modern athletes understand that recovery isn’t just about getting enough sleep—it’s about establishing consistent patterns that synchronize with your body’s natural rhythms.
Sleep plays a critical role in recovery, directly affecting your fatigue levels and athletic performance. When you monitor your sleep patterns effectively, you’ll identify specific areas for improvement that can enhance your recovery process.
Tracking your recovery sleep patterns provides valuable data that guides behavioral changes. You’ll notice individual differences in your sleep needs, which require personalized monitoring approaches rather than generic recommendations. Research shows that athletes experience longer sleep latency and lower sleep efficiency compared to non-athletes, making targeted monitoring even more essential.
Key benefits of monitoring recovery sleep patterns include:
- Identifying ideal sleep duration for your specific recovery needs
- Recognizing disruptions that impact fatigue levels
- Establishing consistent bedtime routines that enhance recovery
- Personalizing sleep strategies based on your training demands
Daily Wellness and Mood Assessment Surveys
When you’re monitoring athlete recovery, daily wellness and mood assessment surveys serve as your most sensitive tool for capturing real-time changes in fatigue, sleep quality, muscle soreness, and psychological state. These surveys outperform objective measures like hormonal changes in detecting acute and chronic training loads.
You’ll typically use Likert scales with five response options to assess key constructs. Digital platforms streamline data collection and analysis, creating a feedback loop that informs your training decisions.
| Construct | Assessment Focus | Response Scale |
|---|---|---|
| Sleep Quality | Duration and restfulness | 1-5 Likert |
| Fatigue Level | Physical exhaustion state | 1-5 Likert |
| Muscle Soreness | Recovery status indicators | 1-5 Likert |
| Mood State | Psychological readiness | 1-5 Likert |
| Stress Level | Mental strain markers | 1-5 Likert |
This data integration helps you personalize training adjustments and minimize injury risk. To maintain accurate responses and athlete engagement, implement surveys 2-4 times per week rather than daily to avoid survey fatigue.
Training Load Calculation and External Stress Metrics
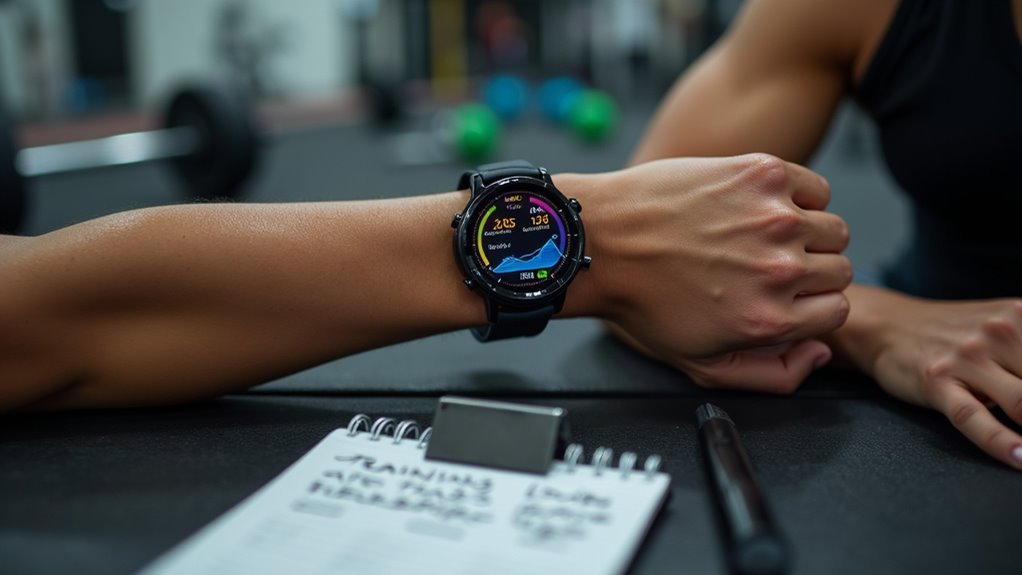
Training load calculation transforms your subjective wellness data into objective metrics that quantify the physiological demands you’re placing on your athletes. You can monitor internal stress through heart rate data combined with session duration, or use RPE multiplied by workout time for workload values.
External stress metrics focus on measurable performance outputs independent of physiological responses.
Key external stress metrics you should track include:
- Power output – Measures sustained performance like 400W for 30 minutes in cycling
- Volume load – Calculates total work from sets, reps, and weight in resistance training
- Device displacement – Quantifies movement patterns during exercises
- Mean power sustained – Reflects your athlete’s ability to maintain performance over time
When external performance remains constant but internal stress increases, you’ve identified potential fatigue patterns requiring intervention. This monitoring helps you follow the 10% rule for gradual workload increases to prevent overreaching and injury.
Body Battery and Energy Level Indicators
Body Battery technology converts your athlete’s physiological data into actionable energy insights that complement traditional fatigue monitoring methods.
Transform raw physiological data into smart energy insights that enhance your traditional fatigue monitoring approach.
This Garmin feature analyzes heart rate variability, stress levels, and movement patterns to estimate energy reserves throughout the day. You’ll receive scores categorized into four bands: low, medium, high, and very high, helping you determine ideal training windows.
The system requires at least one week of continuous data collection to accurately predict energy levels. Sleep quality greatly impacts scores, making recovery tracking more thorough. The feature integrates seamlessly with the Garmin Connect platform for comprehensive wellness tracking.
You can use these insights to enhance training timing, plan recovery periods, and prevent overtraining injuries.
However, accuracy varies based on device fit and environmental conditions, so you’ll need consistent wear patterns for reliable data interpretation.
Stress Level Monitoring Throughout the Day
While Body Battery provides valuable energy insights, continuous stress level monitoring throughout the day offers deeper physiological understanding of your athlete’s recovery state.
You’ll gain access to real-time stress indicators that reveal how training loads affect your athletes’ nervous systems beyond simple energy depletion.
Heart rate monitoring serves as your primary stress indicator, reflecting internal load during exercise and recovery periods. You can track subjective experiences through psychometric methods, capturing individual stress responses that objective data might miss.
This continuous monitoring enables early intervention before stress accumulates into overtraining syndrome. Since all stressors contribute to the same adaptive reserves pool, monitoring helps coaches understand how life stress impacts training capacity.
Key stress monitoring components include:
- Heart rate variability tracking – Monitors autonomic nervous system recovery
- Subjective stress questionnaires – Captures perceived stress levels
- Sleep quality assessment – Evaluates mental and emotional recovery
- Alert systems – Notifies when stress thresholds are exceeded
Recovery Time Recommendations Based on Activity Data
Activity data transforms stress monitoring insights into actionable recovery protocols that optimize your athletes’ training adaptations.
Your baseline recommendation starts with 8–24 hours between intense sessions, but you’ll adjust this window based on specific activity metrics. When your athletes cover greater distances or maintain higher intensity levels, they’ll need extended recovery periods.
Monitor their heart rate data carefully—elevated resting rates or slower post-exercise recovery signals inadequate rest.
Sleep tracking provides essential recovery insights, as poor sleep quality extends necessary recovery time. You’ll find that workout duration, intensity, and repetitive motion frequency all influence recovery needs. Effective training causes microscopic muscle damage that requires adequate time for the body to rebuild and strengthen.
Use wearable technology to track these variables continuously, allowing you to personalize recovery recommendations and prevent overtraining while maximizing performance gains.
Frequently Asked Questions
How Often Should Biochemical Blood Markers Be Tested for Fatigue Monitoring?
You should test biochemical blood markers every 4-6 weeks for chronic fatigue monitoring. Schedule detailed panels only 4 times yearly. You’ll want personalized timing based on your sport, training intensity, and individual biomarker variability.
What Performance Tests Are Most Effective for Detecting Early Overtraining Signs?
You’ll find 2-minute high-intensity tests like rowing most effective for early overtraining detection. They’re combined with heart rate variability monitoring, maximal ergometric tests, and POMS questionnaires to catch performance decrements before they worsen.
How Do Environmental Factors Affect the Accuracy of Heart Rate Measurements?
Temperature extremes, noise pollution, and bright nighttime light disrupt your heart rate measurements by triggering stress responses and altering autonomic function. You’ll get most accurate readings in quiet, 20-25°C environments with minimal pollutants.
Which Hormonal Markers Best Indicate Chronic Fatigue in Competitive Athletes?
You’ll find testosterone/cortisol ratio most reliably indicates chronic fatigue, as lowered testosterone with elevated cortisol creates a catabolic environment. You should also monitor growth hormone responses and IGF-1 fluctuations for thorough assessment.
How Can Coaches Distinguish Between Central and Peripheral Fatigue Symptoms?
You’ll notice central fatigue through decreased motivation and mental tiredness that improves quickly with rest, while peripheral fatigue shows localized muscle weakness and soreness requiring longer recovery periods.
In Summary
You’ll get the best recovery insights when you track multiple metrics together rather than relying on just one feature. Your wearable’s combination of heart rate variability, sleep data, stress monitoring, and training load calculations creates a detailed picture of your body’s recovery status. Don’t ignore the daily wellness surveys—they’re essential for understanding how you’re actually feeling. Trust the recovery recommendations, but always listen to your body’s signals too.

Leave a Reply