You should compare running efficiency scores between devices because different sensors, algorithms, and sampling rates create significant discrepancies that can mislead your training decisions. Garmin emphasizes biomechanical dynamics while COROS focuses on predictive heart rate analytics, leading to conflicting efficiency measurements. These inconsistencies can cause overtraining or undertraining when you rely on a single device’s data. Cross-validation helps identify reliable metrics and prevents device-specific anomalies from sabotaging your performance goals and recovery planning.
Understanding Running Efficiency Metrics Across Different Devices
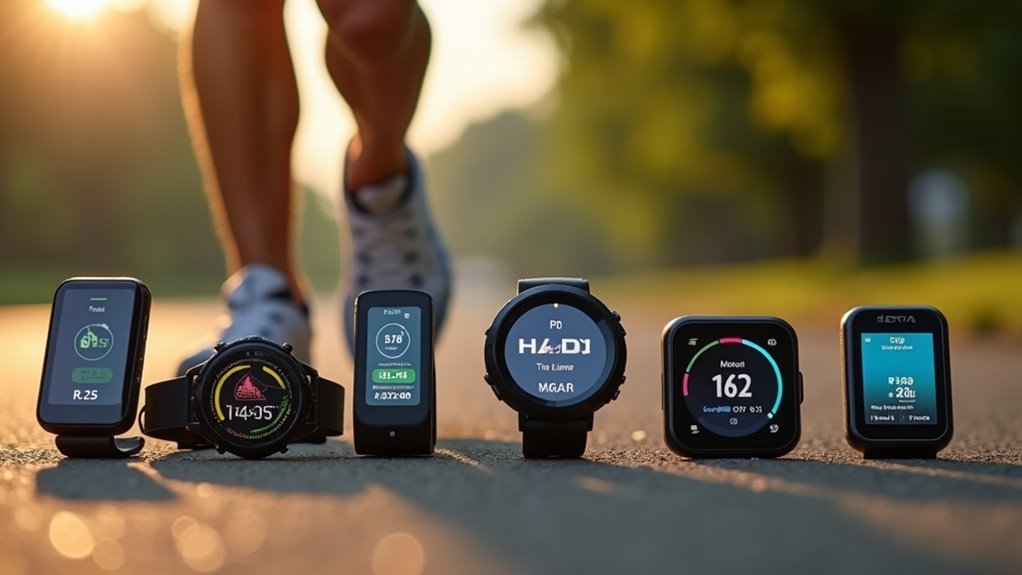
When you’re trying to improve your running performance, you’ll encounter various efficiency metrics that promise to quantify how effectively you use energy at any given pace.
These metrics include cadence, vertical oscillation, ground contact time, and running power—each designed to reveal different aspects of your form and economy.
However, you’ll quickly discover that devices vary considerably in their approaches. Some rely on IMUs placed on your foot, hip, or torso, while others integrate GPS data with accelerometry and force sensors.
These differences in sensor placement and proprietary algorithms create discrepancies in measurements, even when tracking the same metric. Most running analytics devices have a lifespan averaging 2-3 years before requiring replacement, which compounds the challenge of maintaining consistent long-term performance tracking.
You can’t simply compare vertical oscillation readings between brands and expect consistency, as each manufacturer uses different computation methods and sampling rates.
The Role of Heart Rate Data in Device Comparisons
Among all the variables that contribute to running efficiency calculations, heart rate stands out as the most universally measured yet problematically inconsistent data point across devices. Your efficiency score typically divides pace by heart rate, making accurate heart rate data essential for meaningful comparisons.
However, wrist-based optical sensors vary greatly in precision between manufacturers, while chest straps generally provide more reliable readings.
You’ll encounter issues when devices use different sampling rates, smoothing algorithms, or normalization methods. Heart rate variability, sensor errors, and motion artifacts can skew your calculations differently across devices.
When you’re tracking efficiency improvements over time, switching devices complicates your analysis since each manufacturer’s algorithm processes heart rate data uniquely, potentially masking genuine fitness adaptations. Since heart rate reflects past activity rather than current effort, delays in heart rate response can create inconsistencies in real-time efficiency calculations across different devices.
Key Differences Between Garmin, COROS, and Other Efficiency Algorithms
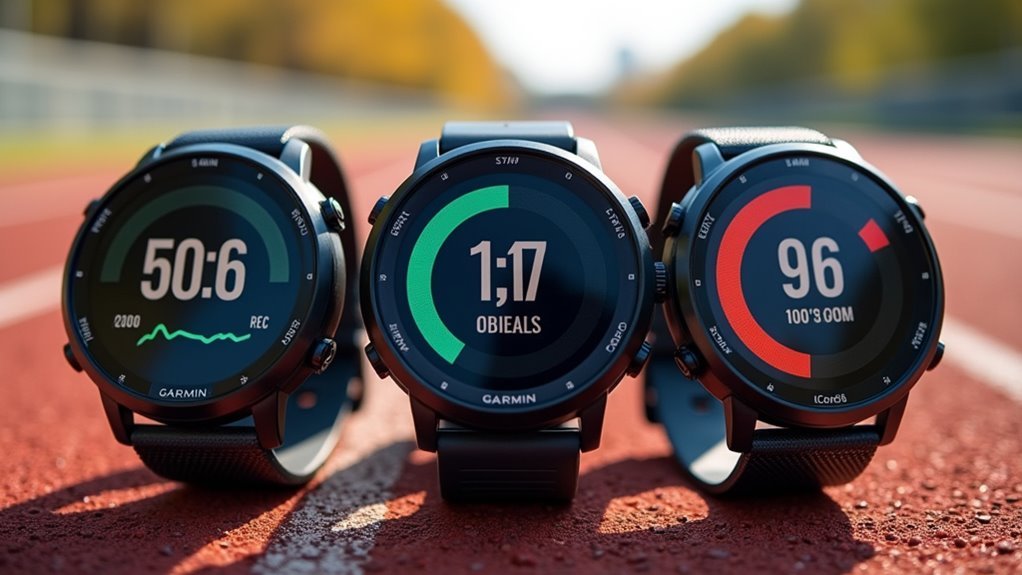
When you’re comparing efficiency algorithms, you’ll notice Garmin takes a thorough approach by emphasizing running dynamics data like stride length and cadence to calculate your performance metrics.
COROS stands out with its predictive heart rate technology that anticipates your cardiovascular responses during different training phases.
Other brands like Polar and Stryd use alternative calculation methods that can produce markedly different power readings and efficiency scores from the same workout data. COROS provides more accurate race prediction algorithms that have consistently outperformed competing brands in forecasting performance times.
Garmin Running Dynamics Focus
While most GPS watches collect basic running metrics, Garmin’s running dynamics system stands apart through its thorough approach to biomechanical analysis.
You’ll get extensive data including stride length, vertical oscillation, vertical ratio, ground contact time, and balance measurements. These metrics work together to paint a complete picture of your running form efficiency.
What makes Garmin’s approach unique is its integration with Firstbeat Analytics, which combines your physiological data like HRV and VO2 max with running dynamics for holistic insights. The system also tracks average running power, which measures energy expenditure during running by accounting for factors such as heart rate, temperature, hills, wind resistance, and vertical oscillation.
You can access this information through onboard accelerometers or enhance accuracy with Garmin’s optional RD Pod. The system provides both real-time feedback during runs and detailed post-run analysis, helping you understand not just what happened, but why it matters for your performance improvement.
COROS Predictive Heart Rate
COROS takes a fundamentally different approach to heart rate monitoring through its predictive algorithms that leverage sleep patterns and workout history to enhance accuracy.
You’ll find their PPG sensor technology uses sophisticated noise-filtering algorithms that interpret photoplethysmography data more precisely than standard implementations.
Their predictive system offers three distinct heart rate zone models tailored to your specific training needs:
- Lactate Threshold Model – Provides precise zones for high-intensity workouts near your threshold
- Heart Rate Reserve Model – Delivers clinical insights into your aerobic and anaerobic capacities
- Max Heart Rate Model – Creates general training structure based on your maximum heart rate
EvoLab enhances this approach by estimating your running VO2 Max from recent outdoor runs, focusing on current performance data rather than historical averages for more responsive training guidance. This system requires wearing during sleep to automatically calculate your resting heart rate and provide the most accurate training zone recommendations.
Alternative Algorithm Approaches
Running efficiency algorithms vary dramatically across manufacturers, with each brand prioritizing different data inputs and calculation methods to assess your performance.
Garmin’s approach centers on Running Economy, measuring aerobic efficiency through heart rate, speed, and running dynamics like ground contact time and stride length. You’ll need their HRM-Run chest strap for advanced metrics including Step Speed Loss, which measures horizontal braking forces. The measurement uses mL/kg/km units where lower values indicate better running efficiency.
COROS focuses on integrating heart rate and GPS data but doesn’t emphasize specific efficiency metrics like Garmin does.
Stryd takes a power-based approach, analyzing efficiency through metrics like Leg Spring Stiffness and Impact Loading Rate using their foot pod device.
Polar incorporates heart rate variability for recovery-based efficiency insights, while Suunto emphasizes overall performance tracking rather than dedicated efficiency calculations.
How Device Variability Affects Training Strategy Decisions
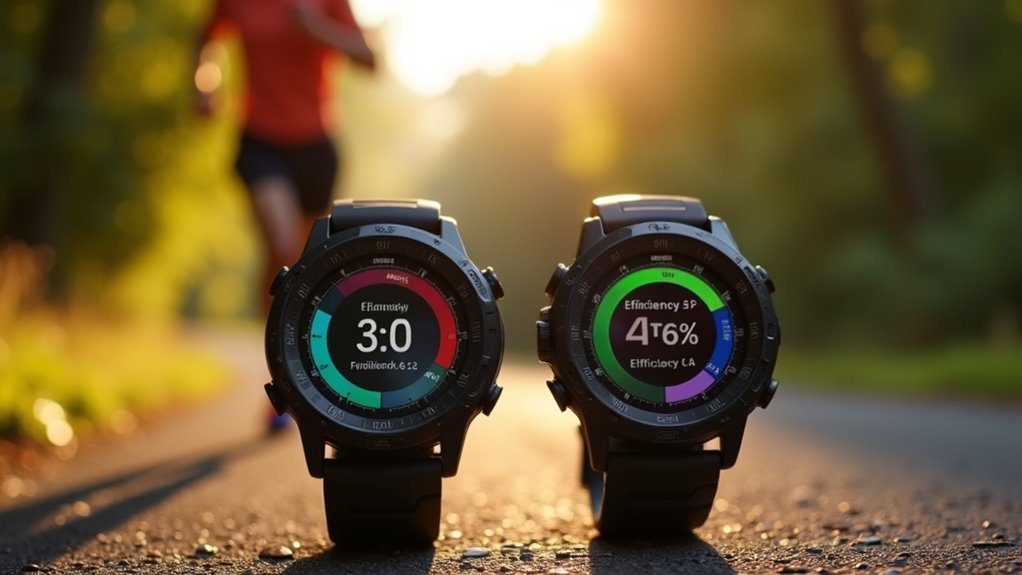
Although modern running devices promise precise efficiency measurements, the reality is that significant variability between brands and models can dramatically alter your training decisions.
When your Garmin shows an efficiency score of 85% while your Polar displays 92% for the same run, you’re facing conflicting data that directly impacts your strategy.
This variability affects three critical training elements:
- Intensity adjustments – Inconsistent efficiency scores can lead you to overtrain or undertrain based on which device you trust.
- Progress tracking – Different baselines make it impossible to accurately monitor improvements over time.
- Recovery planning – Conflicting data compromises your ability to determine ideal rest periods and nutrition timing.
Without consistent measurements, you can’t make informed decisions about when to push harder or when to scale back your training intensity. This challenge becomes even more pronounced when devices incorporate autonomic nervous system data, as these measurements can vary significantly between manufacturers’ algorithms.
Technical Requirements That Impact Score Accuracy
When your running watch calculates efficiency scores, it’s processing data through a complex web of technical requirements that directly determine accuracy. Your device’s sensor precision forms the foundation—inaccurate sensors produce unreliable efficiency measurements regardless of sophisticated algorithms.
You’ll need consistent algorithms across device models to guarantee comparable results between different brands or versions. Higher data sample rates capture more detailed running dynamics, improving your score’s accuracy by analyzing subtle movement patterns that lower rates might miss.
Device calibration becomes essential, especially when you’re running in varying conditions. Without proper calibration, your efficiency scores can drift markedly from actual performance. Lab measurements remain the gold standard for validation, though they’re impractical for regular monitoring due to cost and accessibility constraints.
Interoperability between devices enables cross-validation, letting you verify scores across multiple platforms and identify potential measurement inconsistencies that single-device analysis might overlook.
Benefits of Cross-Device Efficiency Score Validation
When you validate your running efficiency scores across multiple devices, you’ll gather data from different sources that reveal inconsistencies and boost overall accuracy.
This cross-device approach lets you identify which metrics remain stable regardless of your GPS watch, smartphone, or fitness tracker. Similar to K-Fold validation in machine learning, this method ensures reduced variance in your performance measurements by testing consistency across different data collection sources.
You can then use these reliable measurements to optimize your training plans with confidence, knowing your efficiency improvements are real rather than device-specific anomalies.
Accuracy Through Multiple Sources
Since each running device employs distinct sensors and proprietary algorithms to calculate efficiency scores, you’ll encounter significant variability when comparing results across different platforms.
Cross-validation techniques systematically assess your efficiency metrics across multiple devices, providing a robust accuracy estimate that reduces bias from any single source.
When you triangulate data from several devices, you’ll achieve more reliable insights:
- Enhanced sample robustness – Combining multiple data sources increases your measurement confidence while smoothing out device-specific anomalies.
- Error identification – Discrepancies between devices highlight potential measurement limitations or calibration issues.
- Comprehensive profiling – Each device’s sensor strengths contribute to a more complete physiological assessment.
This multi-source validation prevents overreliance on potentially flawed single-device readings for critical training decisions. The approach enables effective model comparison between different device algorithms to determine which provides the most accurate efficiency measurements for your specific running profile.
Training Plan Optimization
Cross-device efficiency score validation transforms your training plan from guesswork into precision coaching.
When you compare efficiency metrics across multiple devices, you’ll identify discrepancies in heart rate and pace data that could skew your training intensity zones. This prevents you from under- or overtraining based on faulty readings.
Validated efficiency scores enable dynamic training adjustments based on consistent trends rather than device-specific anomalies. You’ll develop more accurate heart rate-to-effort ratios, allowing personalized progression that matches your actual physiological adaptations.
Cross-device validation also supports smarter recovery timing and load management. Just as cross-validation prevents overfitting in machine learning models, comparing measurements across devices prevents your training from becoming too narrowly adapted to one device’s measurement patterns.
When you confirm that elevated heart rates at given paces reflect true fatigue rather than measurement error, you can optimize your training cycles with evidence-based decisions about when to intensify or taper.
Identifying the Most Reliable Efficiency Measurements
Although running efficiency measurements promise valuable insights into your performance, the reliability of these metrics varies dramatically across devices and testing conditions.
You’ll find the most accurate results when devices undergo proper validation against lab-based metabolic measurements and direct oxygen uptake testing.
To identify reliable efficiency measurements, focus on these key indicators:
- Multi-parameter analysis – Devices that combine GPS, heart rate, cadence, and power data provide more thorough assessments than single-metric systems.
- Standardized testing protocols – Look for devices that measure efficiency during submaximal, steady-state workloads with consistent environmental conditions.
- Scientific validation – Choose devices validated against laboratory equipment like INSCYD software or direct metabolic testing systems.
You’ll achieve better accuracy by using multiple data sources rather than relying on one device’s proprietary algorithm. Running economy can vary up to 40% among athletes, which emphasizes why device consistency becomes crucial for meaningful comparisons.
Device Selection Based on Efficiency Metric Strengths
When you’re choosing a device for running efficiency measurement, you’ll find each brand emphasizes different strengths that align with specific training goals.
Garmin’s Running Dynamics platform excels at biomechanical form analysis through ground contact time and vertical oscillation metrics, while COROS specializes in predictive heart rate analytics that forecast performance potential.
Tredict stands out by offering power-based calculations that quantify the mechanical work you’re producing, giving you a direct measurement of energy output rather than relying solely on physiological proxies. These efficiency metrics also provide valuable context through community comparisons against established databases, helping you understand how your performance measures against other runners at similar levels.
Garmin Running Dynamics Focus
Since each Garmin device emphasizes different running efficiency metrics with varying degrees of accuracy, you’ll want to match your specific training goals with the device’s strongest measurement capabilities.
Garmin’s wrist-based measurement technology delivers thorough running dynamics without requiring additional accessories, except for ground contact time balance. You’ll benefit from real-time color gauges that compare your metrics against average runners, helping you identify immediate form adjustments during your runs.
Consider these key Garmin advantages when selecting your device:
- Customizable data screens that let you prioritize specific efficiency metrics most relevant to your training
- Built-in accelerometers providing consistent cadence and vertical oscillation measurements without accessories
- Integration capabilities with running dynamics pods for enhanced ground contact time balance data
You can add running dynamics screens to any activity and customize which primary metric displays prominently on your watch face. The color zones are based on percentiles that allow you to see how your performance compares with other runners of different experience levels.
COROS Predictive Heart Analysis
While Garmin focuses on mechanical running dynamics, COROS takes a fundamentally different approach by prioritizing cardiovascular efficiency through its Predictive Heart Analysis system.
You’ll find this method correlates your heart rate intensity directly with running pace, creating a more representative metric of your actual fitness improvements.
COROS’s system requires specific conditions for accuracy: outdoor runs lasting at least seven minutes with steady three-minute intervals, maintaining 65-95% of your max heart rate.
The watch processes local workout data while the app aggregates 42 days of training for thorough scoring.
This predictive modeling adapts through EvoLab, filtering unreliable data to maintain precision. External factors like sleep quality, heat exposure, and fatigue levels can significantly impact your efficiency readings beyond just pace and heart rate data.
You’re getting cardiovascular insights rather than mechanical outputs, helping optimize pacing decisions and recovery planning through physiological responses.
Tredict Power-Based Calculations
Unlike heart rate-focused systems, power-based calculations from devices like Stryd and Polar shift your training emphasis toward mechanical output measurement.
These devices use sophisticated algorithms and sensor technology to estimate forces and accelerations, providing real-time data that’s less influenced by external factors like heat or caffeine.
When selecting power-based devices for efficiency analysis, you’ll want to take into account:
- Algorithm sophistication – Custom algorithms accounting for terrain and environmental conditions deliver more accurate metrics
- Sensor quality – Advanced accelerometers and barometric sensors guarantee reliable force measurements
- Environmental adaptability – Devices that adjust calculations for different terrains provide versatile training data
Power-based efficiency measurements offer consistent baselines for comparing performance across varying conditions, making them valuable for structured training programs focused on mechanical improvements.
Modern power-based devices provide lab-grade precision that enables runners to make data-driven adjustments to their training protocols with unprecedented accuracy.
Optimizing Training Plans Through Comparative Data Analysis
Four key data integration strategies form the foundation of optimizing your training plans through comparative analysis.
Platform comparison reveals consistency across devices, while standardization guarantees reliable insights. Data normalization enables accurate comparisons, and multi-device input provides thorough performance views.
You’ll discover detailed performance insights by comparing running efficiency scores across platforms. These comparisons highlight discrepancies that improve training effectiveness and help identify performance plateaus.
Cross-platform validation alerts you to potential injury risks through data inconsistencies. Advanced systems track your training condition continuously to determine optimal competition readiness timing.
AI-powered platforms like Predictive Fitness leverage comparative data to optimize your performance improvements while reducing injury risk. Their nSight optimization engine processes massive datasets, enabling real-time training adjustments.
You’ll benefit from dynamic monitoring that considers infinite scenarios, guaranteeing your training plans remain effective and relevant through continuous data-driven optimization.
Long-Term Performance Tracking Across Multiple Platforms
When you switch between different running devices and platforms throughout your training journey, maintaining consistent performance tracking becomes essential for understanding your true progress over time.
Cross-platform tracking enables you to observe meaningful trends regardless of device upgrades or brand changes.
Effective long-term monitoring across multiple platforms provides three key advantages:
- Continuity preservation – You’ll maintain your fitness journey data despite switching between Garmin Connect, Strava, or other platforms.
- Pattern identification – You can detect training effects, plateaus, and performance improvements by consolidating data from various sources.
- Equipment validation – You’re able to compare device accuracy and select ideal tools for future monitoring.
Third-party aggregation services and API integrations help harmonize data formats, while consistent metrics like pace, heart rate, and VO₂ max enable meaningful comparisons across ecosystems. With over 50 GPS running watches tested by professional reviewers, the accuracy differences between devices can significantly impact your long-term performance analysis.
Frequently Asked Questions
Can I Use Efficiency Scores From Different Devices Interchangeably for Races?
You shouldn’t use efficiency scores from different devices interchangeably for races. Each device employs unique algorithms, sensors, and scoring methods, making cross-device comparisons unreliable for race pacing strategies.
Do Weather Conditions Affect Efficiency Score Accuracy Across All Devices Equally?
No, weather conditions don’t affect all devices equally. You’ll find different sensors respond variably to humidity, temperature, and solar radiation, causing inconsistent accuracy across brands due to varying calibration methods.
Should I Replace My Current Device if Efficiency Scores Seem Inaccurate?
You should consider replacing your device if efficiency scores consistently show significant inaccuracies that affect your training decisions, but first compare with other devices and explore calibration options.
How Often Should I Recalibrate Devices for Consistent Efficiency Measurements?
You should recalibrate devices quarterly or semiannually for consistent efficiency measurements, depending on usage frequency and environmental conditions. Regular calibration prevents measurement drift and guarantees accurate data for reliable trend analysis.
Are Efficiency Scores Reliable for Trail Running or Only Road Running?
You’ll find efficiency scores more reliable for road running due to consistent terrain. Trail running’s varied surfaces, elevation changes, and unpredictable conditions can affect device accuracy and data interpretation considerably.
In Summary
You’ll maximize your training potential by comparing running efficiency scores across devices. Don’t rely on a single metric—cross-reference data from multiple platforms to identify true performance trends. You’re making more informed decisions when you understand each device’s strengths and limitations. Switch between devices strategically based on your training phase needs. You’ll develop a thorough view of your running efficiency that transcends any single manufacturer’s algorithm.


Leave a Reply