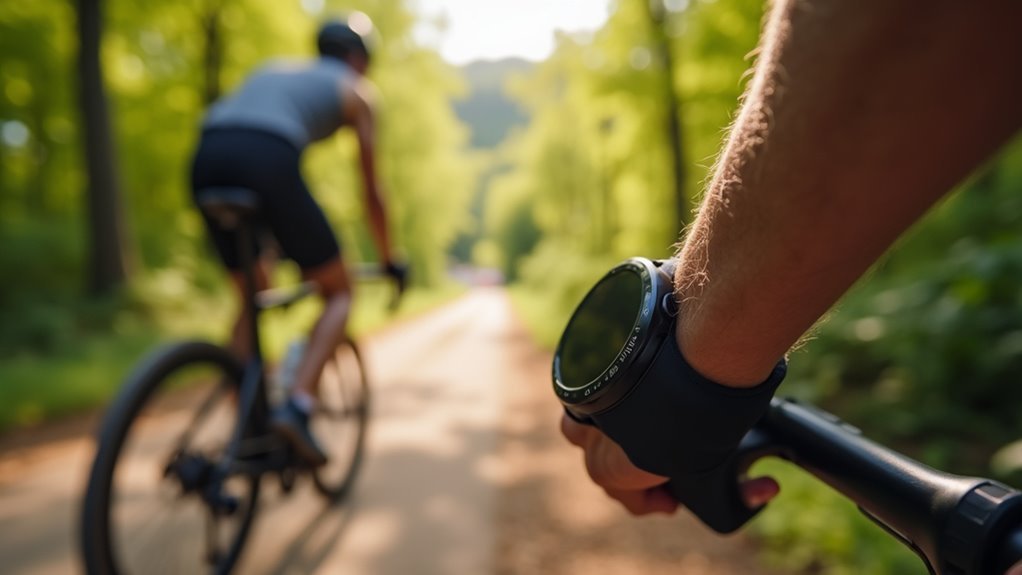
The seven best hill climbing metrics for your cycling wearable include power-to-weight ratio (W/kg) to measure climbing efficiency, VAM (vertical ascent meters per hour) for objective performance comparison, elevation gain tracking using barometric altimeters, real-time gradient percentage monitoring, heart rate response during climbs, cadence optimization ranging from 65-90 RPM, and automatic climb categorization from Category 4 to Hors Catégorie. These metrics work together to optimize your climbing performance and prevent burnout during sustained ascents, revealing advanced techniques that’ll transform your approach.
Power-to-Weight Ratio (W/kg) for Climbing Performance

When you’re grinding up a steep mountain pass, your power-to-weight ratio becomes the definitive metric that separates the climbers from the rest of the pack. Calculated by dividing your power output in watts by your weight in kilograms, this measurement directly determines your climbing speed and efficiency on steep terrain.
Your cycling wearable’s power meter tracks this essential data, allowing you to optimize performance through targeted training intervals like 20-minute threshold tests.
While absolute power matters on flats, W/kg dominates in mountains where gravity becomes your primary opponent.
You can improve this ratio through structured training programs that boost power output or strategic weight management. Professional male climbers achieve over 6.0 W/kg, while most TrainerRoad athletes typically range between 2.25 to 3.5 W/kg, providing realistic benchmarks for your climbing goals.
Smart trainers and wearables integrate this technology, providing real-time feedback that transforms your climbing ability through consistent, data-driven training decisions.
Vertical Ascent in Meters per Hour (VAM)
You can calculate VAM using a simple formula: multiply the meters you’ve climbed by 60, then divide by the minutes spent climbing to get your ascent rate in meters per hour.
This metric originated from Italian cycling coach Dr. Michele Ferrari and provides an objective way to compare your climbing performances across different hills and conditions. VAM values rise exponentially as the gradient of the climb increases, making it particularly valuable for analyzing performance on steep ascents.
Most modern cycling computers and GPS devices now display VAM in real-time, giving you immediate feedback on your climbing pace without needing a power meter.
VAM Calculation Method
Since VAM (Velocità Ascensionale Media) measures your vertical climbing rate in meters per hour, understanding its calculation method becomes essential for tracking hill climbing performance on cycling wearables.
The formula is straightforward: VAM = (meters ascended × 60) / minutes it took to ascend. You’ll need accurate GPS elevation data and precise timing for reliable results.
Your cycling computer or smartwatch calculates this automatically during rides, providing real-time feedback on steep ascents. For example, if you climb 500 meters in 30 minutes, your VAM equals 1000 m/h.
This calculation works best on sustained, steep climbs where elevation accuracy matters most. VAM values rise exponentially as gradient increases, making it particularly valuable for comparing performance across different climb difficulties. Modern wearables integrate VAM seamlessly, letting you monitor climbing performance without manual calculations.
Real-Time VAM Display
Modern cycling wearables transform VAM from a post-ride calculation into an active training tool by displaying your vertical ascent rate as it happens.
You’ll receive immediate feedback to adjust your pacing during climbs, helping you maintain ideal effort levels throughout long ascents.
Real-time VAM display offers these key advantages:
- Instant performance feedback – Adjust your climbing pace immediately based on current VAM readings
- Strategic pacing control – Monitor your effort to avoid burning out on extended climbs
- Live comparison tracking – Compare your current performance against previous attempts on the same climb
- Power estimation alternative – Get power-to-weight insights when you don’t have a power meter
Most modern GPS cycling computers and smartwatches can calculate and display VAM in real-time, making this valuable metric accessible during every ride. VAM values rise exponentially as gradient increases, making real-time monitoring especially valuable for understanding effort changes on varying terrain.
Elevation Gain and Barometric Altitude Tracking
Elevation gain represents the cumulative upward distance you’ve climbed during your ride, making it one of the most important metrics for evaluating hill climbing performance. Modern cycling wearables use two primary methods to track elevation changes, each with distinct advantages and limitations.
| Feature | Barometric Altimeter | GPS-Only |
|---|---|---|
| Accuracy | ±20 feet with calibration | ±400 feet typical |
| Response Time | Immediate elevation changes | May lag on quick changes |
| Weather Sensitivity | Affected by pressure changes | Signal-dependent only |
You’ll get the most accurate results by using devices that combine both technologies. Regularly calibrate your barometric sensor at known elevation points, and use the same device consistently for reliable ride-to-ride comparisons. Keep in mind that barometric altimeters are designed for recreational use rather than precise surveying measurements.
Real-Time Gradient Percentage and Grade Monitoring
While elevation gain tells you how much you’ve climbed, real-time gradient percentage reveals the steepness you’re facing at any given moment. This metric calculates road steepness using the formula: (Rise ÷ Run) × 100, displaying it as a percentage on your device.
Understanding gradient percentages helps you gauge what’s ahead:
- 0-3% gradients feel like gentle “ghost hills” that can fatigue you over time.
- 4-5% climbs require gear changes and occasional standing bursts.
- 6-8% sections demand your granny gear and careful pacing strategies.
- 13%+ gradients represent extreme climbs like those in professional races.
Your wearable’s real-time feedback enables ideal gear selection and effort distribution. Remember that average gradients alone don’t tell the complete story, as climbs often include varying sections with much steeper or flatter grades than the overall percentage suggests.
However, GPS interference and sensor delays can affect accuracy, so combine gradient data with your perceived exertion for best results.
Heart Rate Response During Climbing Segments

As gradients steepen beyond those comfortable 3-5% ranges, your heart rate becomes the most critical metric for gauging climbing intensity and preventing costly burnouts.
During climbs, you’ll often reach near-maximal heart rates, especially when standing versus seated positions due to increased oxygen demands. Your wearable must capture these stochastic heart rate changes accurately, as responses vary dramatically based on fatigue levels, positioning tactics, and environmental conditions like temperature and humidity.
Real-time heart rate data lets you optimize performance by adjusting intensity before hitting unsustainable zones.
However, when you’re overly fatigued, your heart rate response becomes blunted and won’t spike as expected. Cardiovascular drift occurs during extended climbing efforts, causing progressive increases in heart rate even at constant power output. Proper device calibration guarantees accurate readings during these demanding segments, helping you develop personalized training strategies that account for individual variability in cardiovascular response.
Cadence Optimization for Hill Climbing Efficiency
Beyond monitoring your cardiovascular response, cadence becomes the mechanical foundation that determines whether you’ll power through steep climbs efficiently or grind to a halt with burning legs.
Your cycling wearable’s cadence sensor measures crankset RPM, providing real-time feedback to optimize your climbing performance.
Hill climbing cadence varies greatly from flat terrain riding. While you might maintain 85-95 RPM on flats, climbs typically require 65-90 RPM for most cyclists.
- Monitor your personal sweet spot – Some riders excel at 40-50 RPM on steep terrain, while others prefer 80+ RPM
- Match gears to cadence goals – Inadequate gear range forces unnatural cadence and premature fatigue
- Use real-time alerts – Low cadence warnings prevent muscle strain during extended climbs
- Track longitudinal data – Analyze cadence patterns to refine your climbing strategy and gear selection
Testing different cadences on your wearable can reveal significant changes in heart rate and breathing patterns that help identify your most efficient climbing rhythm.
Climb Categorization and Progress Tracking Features
Your cycling wearable can instantly detect when you’re climbing and automatically categorize the difficulty of each ascent based on gradient and distance.
These devices sort climbs into standard categories from 4 to Hors Catégorie, giving you immediate context about the challenge ahead. Modern platforms calculate difficulty points using comprehensive formulas that consider both average ascent and course undulations for more accurate categorization.
You’ll see visual progress displays that track your advancement through each climb segment, helping you pace yourself and monitor your performance in real-time.
Real-Time Climb Detection
When you’re grinding up a steep ascent, your cycling wearable’s real-time climb detection technology becomes your strategic ally, automatically categorizing the difficulty and tracking your progress with remarkable precision.
Your device integrates advanced GPS, accelerometers, and gyroscopes to instantly assess gradient, elevation gain, and distance. This data feeds sophisticated algorithms that categorize climbs and provide immediate feedback on your performance.
You’ll see real-time updates showing distance covered, elevation gained, and projected time to summit.
Key real-time climb detection features include:
- Gradient-based categorization – Automatically classifies climb difficulty based on steepness
- Progress visualization – Shows percentage completed and remaining elevation
- Performance optimization – Tracks power output, cadence, and heart rate simultaneously
- Strategic alerts – Delivers customizable notifications for pacing and performance milestones
Modern cycling computers serve as the command centers for all this climbing data, collecting and displaying metrics that help you make tactical decisions during challenging ascents.
Automatic Route Categorization
Modern cycling wearables excel at automatically categorizing climbs and tracking your progress through sophisticated route analysis systems. Your device analyzes elevation profiles and distance data to detect climbs during routes or rides, then assigns categories like HC or 1-4 based on gradient, length, and regional standards.
You can customize threshold settings to adjust what constitutes a climb, personalizing recognition to your preferences.
During climbs, you’ll receive live progress updates showing your current position on the elevation profile and estimated completion time. Your wearable compares current performance against previous efforts on the same segments while calculating remaining work required. The bright display ensures easy visibility of these metrics even in direct sunlight while riding.
Post-ride analysis tracks climb performance trends across multiple rides, helping you assess improvement over time through thorough fitness insights.
Visual Progress Displays
While climbing detection happens automatically, the real magic lies in how your wearable translates raw elevation data into clear, actionable visual feedback.
Modern devices transform complex terrain into digestible information that keeps you informed and motivated throughout each ascent.
Your cycling computer displays essential climb metrics through multiple visual channels:
- Real-time gradient percentage shows current steepness while colored elevation profiles reveal remaining vertical meters to the summit.
- Progress tracking displays calculate estimated time to completion and animate your advancement through customizable progress bars.
- Map integration features highlight climb sections with chevron icons and colored shading for immediate route recognition. Advanced systems also display climb categories using standardized classifications that remain constant regardless of your position within the route.
- Remaining distance counters show both horizontal meters and vertical elevation left, updating continuously as you advance toward the top.
Frequently Asked Questions
Which Cycling Wearables Offer the Most Accurate Barometric Altimeter for Elevation Tracking?
You’ll find Garmin cycling watches and computers offer the most accurate barometric altimeters, with Apple Watch Ultra 2 and Wahoo devices close behind. These combine pressure sensors with GPS calibration for precise elevation tracking.
How Do Weather Changes Affect Barometric Altitude Readings During Long Climbs?
Weather changes create pressure fluctuations that’ll skew your barometric readings during long climbs. You’ll notice inaccuracies when storms approach or temperatures shift rapidly, requiring recalibration to maintain accurate elevation data throughout your ride.
Can I Calibrate My Cycling Wearable’s Altimeter Before Starting a Climb?
You can calibrate your cycling wearable’s altimeter before climbing using manual reference points, inputting sea level pressure, or accessing device calibration menus to guarantee accurate elevation readings throughout your ride.
Do Gps-Only Devices Significantly Underestimate Elevation Gain Compared to Barometric Sensors?
GPS-only devices typically underestimate elevation gain due to inaccuracies ranging hundreds of meters. You’ll get more reliable climbing data using barometric sensors, which respond quickly to altitude changes and provide better precision.
Which Brands Provide the Best Integration Between Power Meters and Cycling Wearables?
You’ll find Garmin offers the most seamless integration with their Rally power meters and wearables through native compatibility. Favero provides excellent third-party integration, while Wahoo relies entirely on external power meter brands for functionality.
In Summary
You’ll transform your hill climbing performance by tracking these seven essential metrics on your cycling wearable. Focus on power-to-weight ratio and VAM for measuring your climbing strength, while using real-time gradient and heart rate data to pace yourself effectively. Don’t overlook cadence optimization and elevation tracking – they’ll help you maintain efficiency on steep grades. With climb categorization features, you’ll monitor your progress and tackle increasingly challenging ascents with confidence and data-driven strategy.


Leave a Reply