Recovery metrics reveal whether you’re ready for intense training or need rest through key indicators like heart rate variability, sleep quality, and resting heart rate trends. Higher HRV signals readiness for demanding workouts, while lower values suggest reducing training load. Combined recovery scores on a 0-100 scale integrate multiple physiological inputs to guide daily decisions. Power output patterns and subjective feel ratings provide additional insights into your body’s adaptation status. Understanding these interconnected signals transforms your training effectiveness.
The Science Behind Sleep Quality and Training Adaptation

While you’re pushing through those demanding training blocks, your body’s most critical adaptation work happens when you’re asleep. Quality sleep directly influences your training efficiency and recovery time, allowing your muscles to repair and adapt to the stress you’ve placed on them.
Your body transforms during sleep, turning training stress into strength through essential muscle repair and adaptation processes.
When you don’t get adequate sleep, you’ll experience reduced performance, increased muscle soreness, and impaired recovery between sessions. Your sleep quality affects how well you can manage training loads without overreaching.
Poor sleep leads to mood changes, increased stress, and frequent nighttime awakenings that compromise sleep efficiency. As training intensity increases, your sleep quality often declines, creating a cycle where reduced recovery impairs your ability to handle future workouts. Cyclists who maintain ≥8 hours of sleep consistently show better energy levels and higher quality training sessions.
Monitoring your sleep patterns helps optimize training adaptations.
Heart Rate Variability as Your Nervous System Dashboard
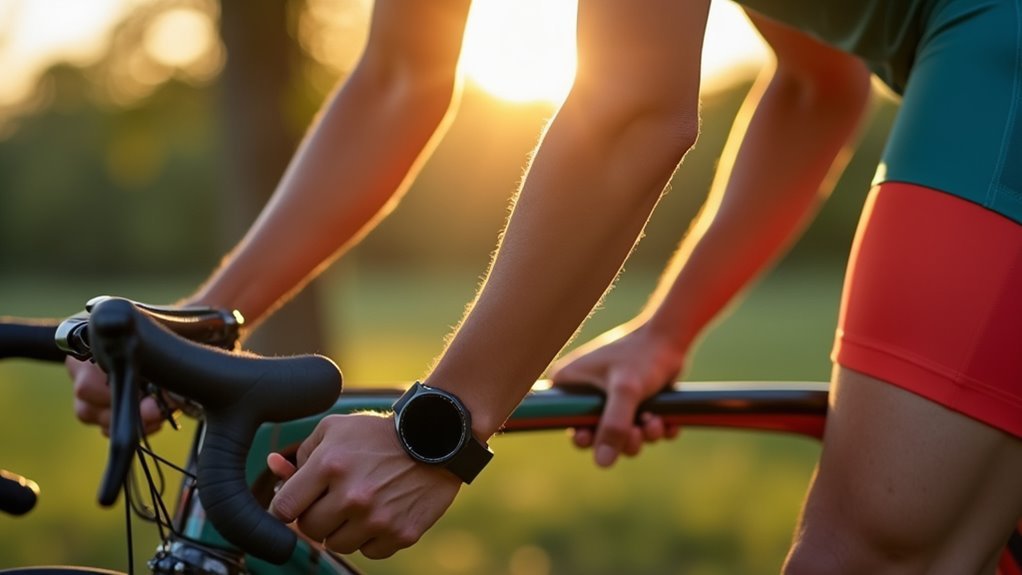
Your sleep patterns reveal one side of your recovery story, but your nervous system tells the complete tale through heart rate variability (HRV). HRV measures millisecond variations between consecutive heartbeats, reflecting your autonomic nervous system’s activity. Higher HRV indicates parasympathetic dominance—you’re recovered and ready for intense training. Lower HRV suggests sympathetic dominance, signaling stress or overtraining.
| HRV Status | Training Decision | Recovery Action |
|---|---|---|
| High HRV | Proceed with planned intensity | Maintain current load |
| Stable HRV | Continue normal training | Monitor trends |
| Low HRV | Reduce intensity/duration | Add rest day |
The LnRMSSD metric guides your training decisions. When it changes by 0.5 times the standard deviation, you’ll need to adjust your training load. Modern smartwatches make HRV tracking accessible, helping you avoid overtraining while optimizing performance windows through dynamic training adjustments. Cyclists can enhance their understanding by tracking HRV alongside resting heart rate, as this combination provides deeper insights into their body’s readiness for training.
Understanding Optimize Recovery Scores for Performance Planning

Beyond HRV’s single-metric approach, optimize recovery scores deliver a thorough readiness assessment by integrating multiple physiological inputs into one actionable number.
These scores combine your resting heart rate, sleep quality, recent training load, and sometimes biomarkers like lactate clearance into a 0-100 scale indicating your recovery percentage.
Recovery scores synthesize resting heart rate, sleep data, training load, and biomarkers into a simple 0-100 percentage scale.
You’ll use these scores to determine whether to push hard, maintain intensity, or prioritize rest. High scores signal readiness for demanding workouts, while low scores indicate you need active recovery or reduced training load to prevent overtraining.
Machine learning algorithms often personalize these calculations to your baseline data.
Track trends over weeks to strategically plan recovery days after heavy training periods, optimizing your training stress-to-rest balance for consistent performance gains. Ignoring these recovery signals can result in a 15-20% decrease in power output during your next training session, making proper interpretation crucial for maintaining performance consistency.
Subjective Feel Ratings and Their Training Implications
Although technology provides sophisticated recovery metrics, your personal perception of effort and fatigue remains one of the most valuable indicators for training decisions. Rating of Perceived Exertion (RPE) serves as an early warning system for overreaching and helps you gauge when intensity adjustments are needed.
Your subjective feelings complement objective data by revealing how your body’s actually responding to training stress:
- Intensity calibration – Adjust workout intensity when efforts feel harder than expected at given power outputs
- Recovery timing – Schedule rest days when you’re feeling unusually fatigued despite normal metrics
- Training volume – Modify weekly volume based on accumulated fatigue sensations
- Performance readiness – Use feel ratings to determine ideal timing for key workouts
RPE proves as effective as scientific equipment for measuring effort, making it a reliable standalone metric when technology isn’t available. Your breathing rate correlates directly with effort level, providing an immediate physiological indicator that complements your perceived exertion scale.
Integrating subjective feel with power, heart rate, and recovery scores creates a thorough training approach that maximizes adaptations while preventing burnout.
Power Output Patterns as Recovery Indicators
While subjective feel provides essential insights into your recovery status, power output patterns offer objective data that can reveal recovery trends before you consciously notice them.
Your power metrics serve as early warning systems—consistent drops in average power across multiple sessions signal inadequate recovery and potential overtraining.
You’ll want to monitor sustainable power trends over weeks or months rather than daily fluctuations.
Upward trends without accompanying pain indicate successful recovery from injuries like Achilles tendon issues.
Power profiling over various durations helps identify specific recovery patterns in neuromuscular power, anaerobic capacity, and threshold power that may recover at different rates.
Your power zones become invaluable for setting appropriate training intensities that facilitate recovery rather than hinder it.
Resting Heart Rate Trends and Cardiovascular Readiness
Your resting heart rate (RHR) provides another objective window into your cardiovascular readiness that complements power data analysis. Measure it first thing in the morning before getting out of bed for the most accurate baseline reading.
Track these key RHR patterns to optimize your training:
- Gradual decreases over weeks signal improving cardiovascular fitness from effective aerobic training
- Sudden spikes above your baseline warn of residual fatigue, stress, or early illness
- Plateau periods may indicate training adaptation or need for program adjustments
- Recovery trends help determine if you’re handling current training loads appropriately
While RHR doesn’t capture everything about performance readiness, combining it with power metrics and subjective feelings creates a thorough recovery picture that’ll guide your daily training decisions. Remember that factors like sleep quality, nutrition choices, hydration levels, and environmental conditions can all influence your heart rate readings, so consider these variables when interpreting your data.
Seven-Day Training Load Impact on Recovery Needs
Since cycling training stress accumulates day by day, tracking your seven-day training load reveals whether you’re pushing too hard or leaving fitness gains on the table.
Weekly load graphs help you visualize stress distribution and compare training impact between weeks, making adjustments easier.
Visual training load patterns reveal weekly stress imbalances and enable precise adjustments for optimal performance progression.
Watch for warning signs when your load exceeds recovery capacity: declining performance, persistent fatigue, low motivation, heavy legs after rest days, and sleep disturbances.
These signals mean you need more recovery time.
Plan recovery weeks every 3–4 weeks to convert training stress into fitness gains. Recovery weeks allow your body to repair and strengthen muscles while facilitating adaptation to the accumulated training stress.
Use rolling seven-day averages to smooth training variability, alternate hard and easy days, and match your recovery intensity to preceding workload.
Base Fitness Development Through Long-Term Monitoring
Because base fitness forms the foundation for all cycling performance, you need months of consistent data collection to track meaningful changes in your aerobic capacity and endurance. Your smartphone apps like Strava or GPS devices from Garmin provide the baseline metrics essential for monitoring long-term adaptations.
Key indicators of base fitness development include:
- Lower heart rate at same power output – signals improved aerobic efficiency
- Increased average speed on familiar routes – demonstrates enhanced endurance capacity
- Extended ride duration without excessive fatigue – reveals growing aerobic base
- Consistent power output trends over months – confirms sustained fitness gains
Submaximal testing like LSCT helps you monitor progress without interfering with recovery. Recording your resting heart rate first thing each morning provides additional insight into your body’s adaptation to training stress and overall fitness development.
When combined with HRV tracking and training diary notes, you’ll identify when to increase training load or prioritize recovery for continued base development.
Load Management Strategies for Overtraining Prevention
Your training load thresholds act as guardrails that prevent you from pushing beyond your body’s adaptation capacity.
You’ll need to establish clear boundaries between productive stress and destructive overreaching by monitoring weekly training loads and staying within 5-10% increases.
Balancing your recovery strategies with these thresholds guarantees you’re building fitness rather than accumulating fatigue that leads to overtraining syndrome. Remember that life stressors beyond cycling contribute to your total stress burden and must be factored into your load management decisions.
Training Load Thresholds
When you’re pushing your limits on the bike, understanding training load thresholds becomes essential for distinguishing productive stress from dangerous overload. Your Functional Threshold Power (FTP) defines the maximum sustainable effort you can maintain without rapid fatigue, while Training Stress Score (TSS) quantifies the physiological stress from each ride by combining intensity and duration.
Here’s how to monitor your training load effectively:
- Track your TSB daily – When Training Stress Balance drops negative, you’re accumulating fatigue.
- Limit CTL increases to 5-10% weekly – Gradual fitness building prevents overload.
- Watch for TSS spikes above normal ATL – Sudden increases signal overtraining risk.
- Train within 90-104% FTP for threshold work – This zone builds sustainable power efficiently.
These metrics help you balance stress and recovery for ideal adaptation. Consistently training below and above threshold enhances your body’s lactate clearance and tolerance capabilities.
Recovery Balance Strategies
The most effective recovery strategy balances deliberate rest with targeted activities that enhance your body’s natural repair processes.
You’ll need to carefully manage your training load to prevent overtraining, which leads to performance decline and increased illness risk. Monitor your fatigue through both subjective feelings and objective metrics to guide load adjustments.
Incorporate one complete rest day or active recovery session weekly during intense training periods. Schedule extended recovery phases with reduced intensity every 3–4 weeks within training blocks.
Your recovery approach should be individualized—whether that’s massage, gentle walking, or light cycling sessions. Recovery rides should last 60-90 minutes at low intensity to help eliminate waste products from hard sessions while maintaining muscle feel.
Avoid sustained under-loading, as this causes detraining. Instead, maintain light intensity workouts during rest weeks to preserve your hard-earned adaptations while allowing proper recovery.
Balancing Training Intensity With Recovery Requirements
You’ll need to monitor your load impact ratios to understand how training stress affects your recovery timeline and performance capacity.
By tracking metrics like power output decline, heart rate variability, and subjective fatigue scores, you can adjust your intensity before overreaching becomes overtraining. Research shows that sex-specific differences in recovery patterns require tailored approaches to high-intensity training protocols.
These data points let you make real-time decisions about when to push harder and when to dial back your efforts for ideal adaptation.
Monitoring Load Impact Ratios
As cycling demands intensify, monitoring load impact ratios becomes essential for preventing overtraining while maximizing performance gains.
You’ll need to track several key metrics that directly impact your recovery requirements and injury risk.
The Acute:Chronic Workload Ratio (ACWR) compares your current week’s training load to your previous 3-4 weeks’ average, helping predict injury risk. When this ratio spikes too high, you’re entering dangerous territory. An optimal ACWR range is between .8 and 1.3, where injury risk remains relatively low.
Essential load impact ratios you should monitor include:
- Training Stress Score (TSS) – Quantifies workout physiological stress and estimates recovery time needed
- Muscle Load – Measures mechanical energy (360-720 kJ for cycling sessions)
- Perceived Load – RPE multiplied by duration for subjective training stress
- Recovery Index – Monitors lactate clearance to optimize post-training recovery
These metrics guide your training decisions and recovery planning.
Adjusting Intensity Using Metrics
When recovery metrics signal fatigue, smart cyclists immediately dial back their intensity rather than pushing through diminished capacity. Low recovery scores indicate your body needs reduced intensity for subsequent sessions, while high scores suggest you’re ready for hard efforts.
Use planned rest days or easy sessions following high-intensity training blocks to maintain balance.
Monitor your intensity factor (IF) metrics, which show the percentage of threshold effort in each session. Balance this data with your recovery scores to optimize training progression without burnout. Environmental factors like temperature and hydration can distort heart rate readings, so consider multiple intensity metrics when making training decisions.
Aim for green recovery metrics three to four times weekly, leaving room for quality hard efforts. Training Stress Scores under 150 typically allow full recovery by the next day, while scores between 150-300 may create residual fatigue lasting into the second day.
Multi-Metric Approaches to Recovery Assessment
Multi-metric approaches revolutionize how you’ll assess recovery by combining multiple data streams into an extensive evaluation framework. Instead of relying on single indicators, you’ll gather thorough insights by integrating physiological markers with subjective feedback.
Multi-metric recovery assessment transforms single-indicator guesswork into comprehensive data-driven insights by integrating physiological markers with subjective feedback streams.
Your multi-metric recovery assessment should include:
- Biomarker tracking – Monitor lactate levels and heart rate variability to gauge physiological stress
- Performance metrics – Track power output and speed changes during standardized tests
- Subjective scoring – Rate your perceived recovery state using consistent scales
- Sleep analysis – Evaluate sleep quality patterns and duration for recovery efficiency
You’ll use statistical modeling and machine learning algorithms to identify patterns across these metrics. This cross-disciplinary approach lets you develop personalized recovery strategies, adjust training intensity appropriately, and optimize your periodization schedule based on extensive data rather than guesswork.
Understanding your optimal recovery intensity helps determine the most effective pace for lactate combustion, as running at moderate pace speeds rather than the slowest possible intensity maximizes your body’s ability to clear accumulated lactate from high-intensity efforts.
Personalizing Recovery Thresholds Using Wearable Data
While generic recovery metrics provide useful starting points, your unique physiological profile demands personalized thresholds that reflect your individual baseline rather than population averages. Your wearable needs several weeks to establish your normal HRV, resting heart rate, respiratory rate, body temperature, and sleep patterns. This baseline profiling prevents misclassifying your personal idiosyncrasies as poor recovery.
Your device tracks sleep architecture specifically, monitoring deep sleep phases that correlate with muscle repair. It’ll flag deviations from your consistent sleep timing and note social jetlag patterns between training and rest days.
The algorithm synthesizes these personalized metrics into daily readiness scores, creating green, yellow, or red zones based on your data—not generic standards. Modern devices may introduce algorithm updates that change how these readiness scores are calculated, potentially affecting your established baselines.
However, don’t ignore your subjective feelings, which often outperform device metrics in predicting true readiness.
Real-Time Training Plan Adjustments Based on Recovery Feedback
Your morning recovery data shouldn’t just inform you about yesterday’s sleep—it should reshape today’s training plan before you even clip into your pedals.
When your HRV drops or training readiness scores tank, you’ll need flexible decision-making that prioritizes long-term gains over rigid scheduling.
Smart cyclists adjust their plans based on recovery feedback:
Data-driven cyclists prioritize recovery metrics over rigid training schedules to maximize performance gains and minimize injury risk.
- Postpone threshold sessions when recovery metrics indicate you’re not ready for high-intensity efforts
- Reduce training intensity during planned workouts if your body’s signaling inadequate recovery
- Insert strategic rest days after your wearable suggests extended recovery time is needed
- Adapt entire training blocks when multiple days of poor recovery data emerge
This data-driven approach prevents overtraining while optimizing physiological adaptation, leading to better race performance and reduced injury risk. Remember that HRV measures systemic stress rather than training stress alone, so everyday factors like work pressure and family responsibilities may influence your readings more than yesterday’s workout.
Frequently Asked Questions
How Do Nutrition and Hydration Choices Affect Recovery Metric Accuracy?
Your nutrition and hydration consistency directly impacts recovery metric accuracy. Proper hydration guarantees reliable heart rate data, while consistent macronutrient intake reduces metric variability, giving you more dependable performance measurements.
Can Weather Conditions Impact HRV and Other Recovery Measurements?
Yes, weather greatly impacts your recovery metrics. Hot, humid conditions elevate your heart rate by 5-10 bpm and delay HRV recovery for 8-24 hours, while cool, dry weather promotes faster normalization.
What Recovery Differences Exist Between Indoor and Outdoor Training Sessions?
You’ll recover faster from indoor sessions due to controlled environments and consistent effort. Outdoor rides create more physiological stress from wind resistance, temperature variations, and unpredictable terrain, requiring longer recovery periods.
How Long Should Cyclists Track Metrics Before Establishing Personal Baselines?
You should track recovery metrics for at least 4-6 weeks before establishing reliable personal baselines. This duration captures natural fluctuations and guarantees you’re making training decisions based on meaningful patterns rather than daily variations.
Do Recovery Metrics Vary Significantly Between Different Cycling Disciplines?
Yes, you’ll find recovery metrics differ markedly between cycling disciplines. Sprint cyclists show different heart rate variability and lactate clearance patterns than endurance riders, requiring discipline-specific interpretation of your data.
In Summary
You’ll maximize your cycling performance by combining multiple recovery metrics rather than relying on single data points. Your sleep quality, HRV, subjective ratings, and power patterns together create a thorough recovery picture. Don’t ignore what your body’s telling you through these signals. Adjust your training intensity based on this feedback, and you’ll see better adaptations while avoiding burnout. Your personalized recovery thresholds will evolve as you gather more data.


Leave a Reply